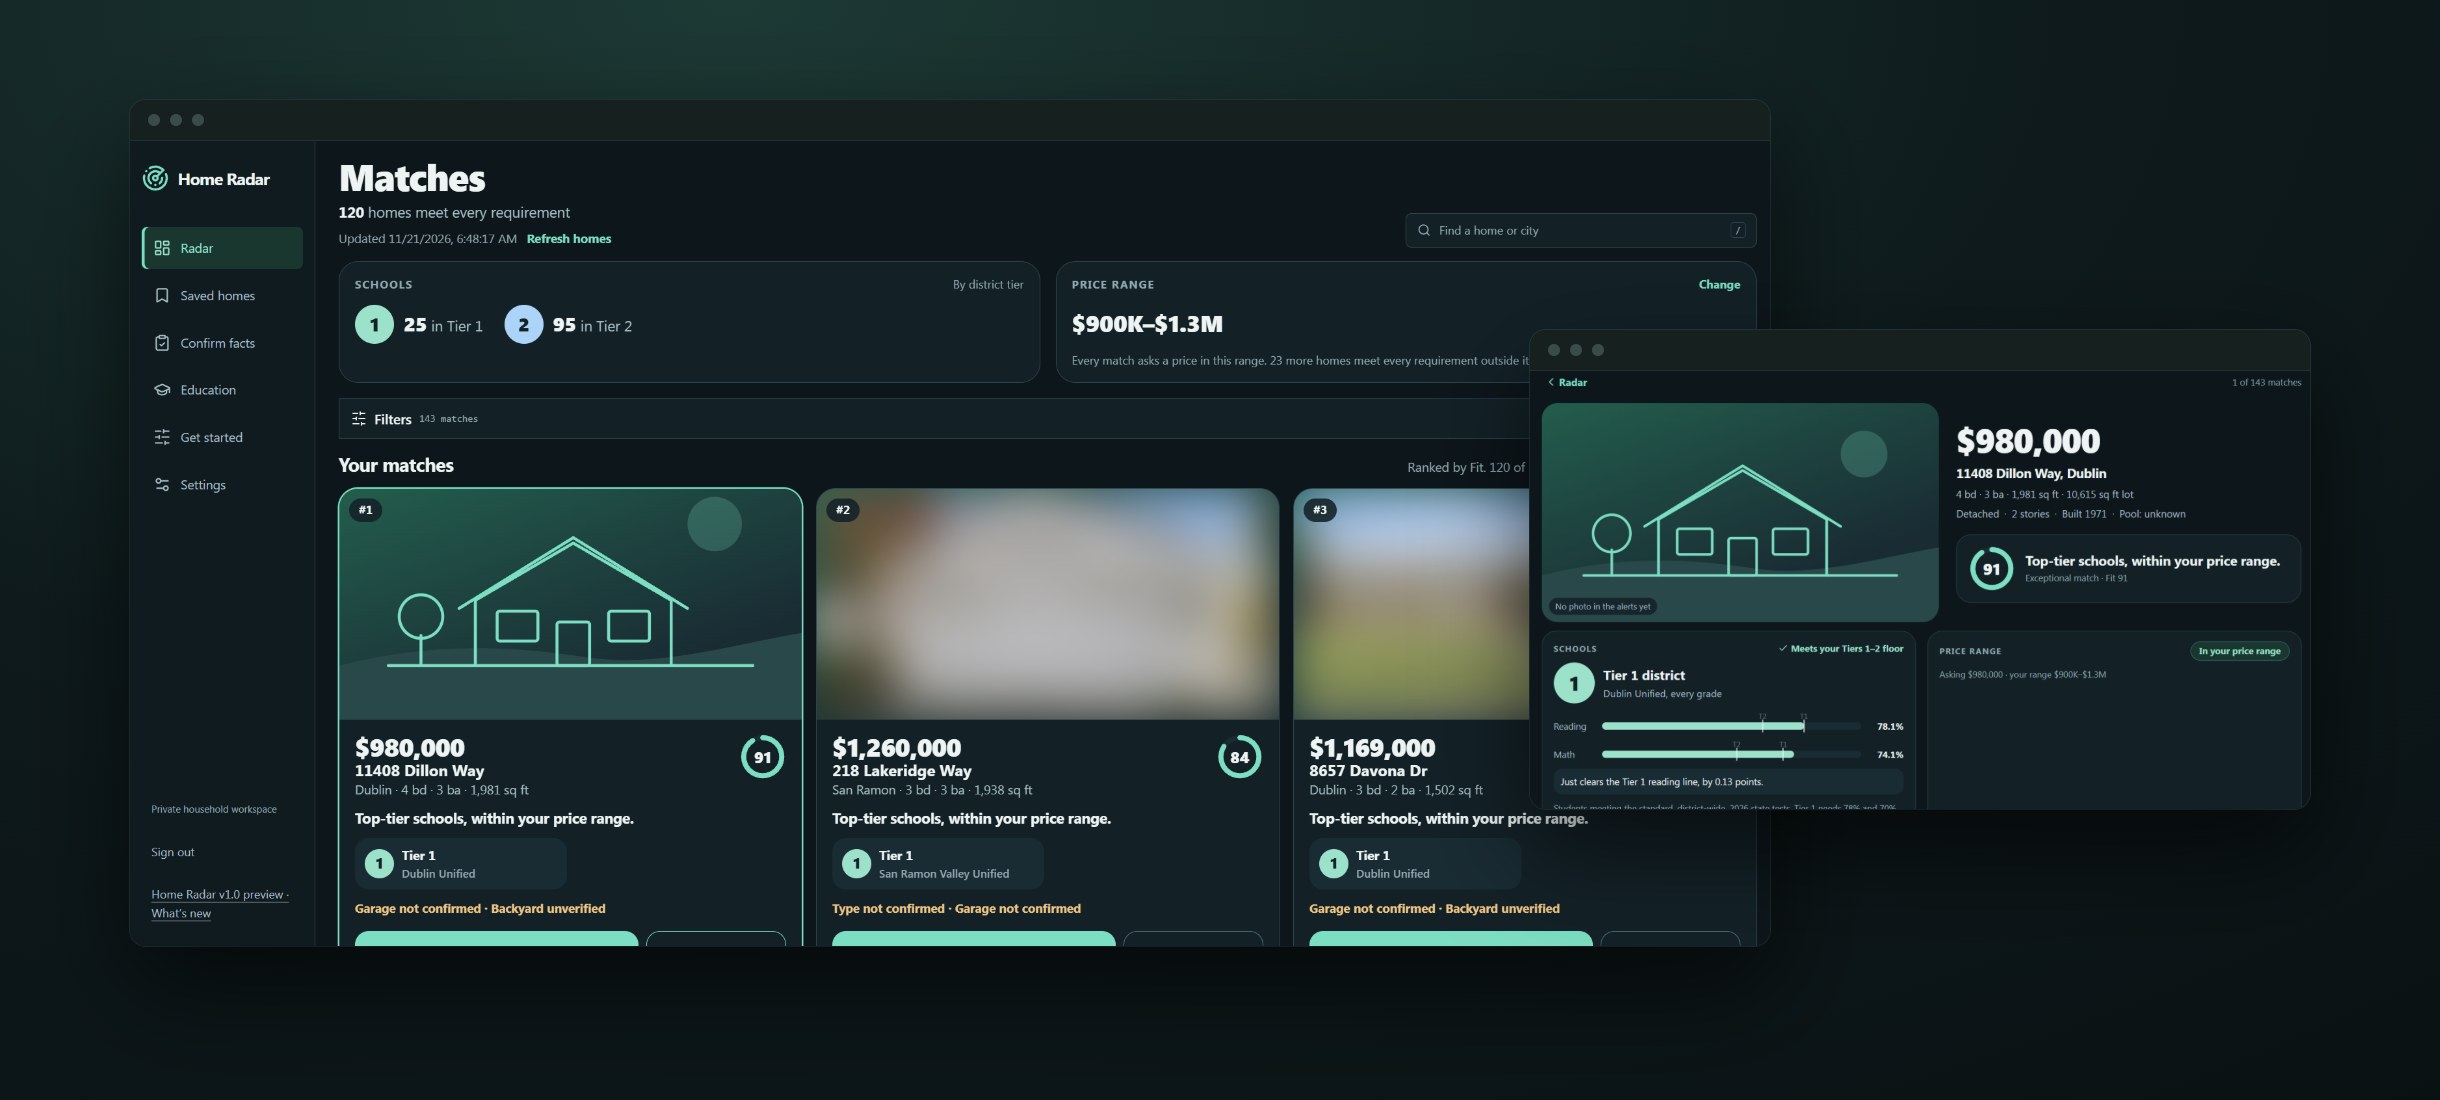
Screens on this page are the live app, signed in. Listing photos are blurred: they belong to the portals and their agents, and Home Radar never stores them.
Screens on this page are the live app, signed in. Listing photos are blurred: they belong to the portals and their agents, and Home Radar never stores them.
Web App / Product, Design & Development
Aug 2026 – present
Next.js
React
TypeScript
Supabase
PostgreSQL + PostGIS
MapLibre
Protomaps
Vercel
Zod
Vitest
Playwright
Web Push
Claude Code
Codex
Listing sites are built to show as many homes as possible, which leaves a family looking for one good house to do the filtering in their heads. Our questions were narrow, and no portal answered them directly. Is it in our price range? How good is its school district, and how sure are we? Does it meet every requirement: detached, enough space, a two-car garage? What do the flood, fire and liquefaction maps say? And what changed since yesterday? Answering those meant checking listings against school results, county records and hazard maps by hand, for hundreds of homes across dozens of cities, every day. Two constraints shaped the rest. The portals restrict automated crawling, so scraping them was off the table. And a wrong answer was worse than no answer: a missing school result or a guessed garage size that quietly flattered a house would send us to the wrong open house.
I designed Home Radar as a decision engine rather than another listing map. Homes come in through the channel the portals already offer, their saved-search alert emails, sent to a private mailbox that a worker reads. Each alert is treated as a pointer to a house, not as the listing. The worker matches it to one record per home, and PostGIS places that home in its school district, parcel and hazard zones from public data. A scoring engine written as pure, synchronous TypeScript ranks it, and the matches reach us through a phone-first web app, a morning email and push notifications. The rules that keep it honest are enforced by tests and lint rather than convention: no AI produces a number anyone sees, missing data can never help a home, and every value carries its source. I built it with Claude Code and Codex, under a written specification and a decision record for every rule that changed.
~670
Homes watched
250+
Decisions recorded
~3,000
Automated tests
0
Numbers produced by AI
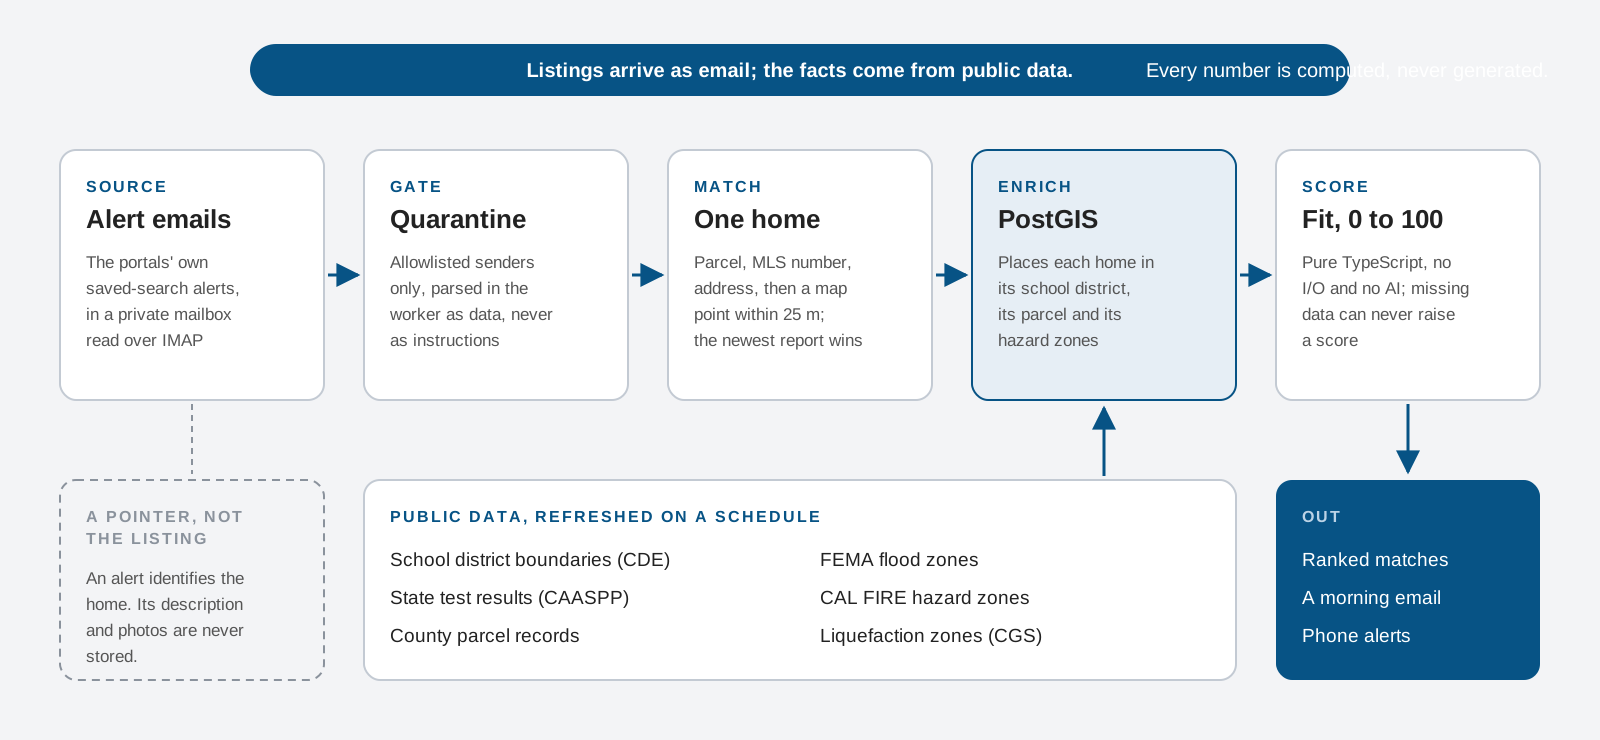
The portals restrict crawling, so Home Radar never crawls them. Instead it subscribes to their own saved-search alerts, which land in a private mailbox that a worker reads over IMAP. Mail is parsed only once its sender checks out, and everything in it is treated as data, never as instructions. An alert only identifies a home; its description and photos are never stored. Matching runs from the strongest evidence down: parcel number, MLS number, address, then a map point within 25 meters. Every merge records how it was made, so a bad one can be traced and undone.
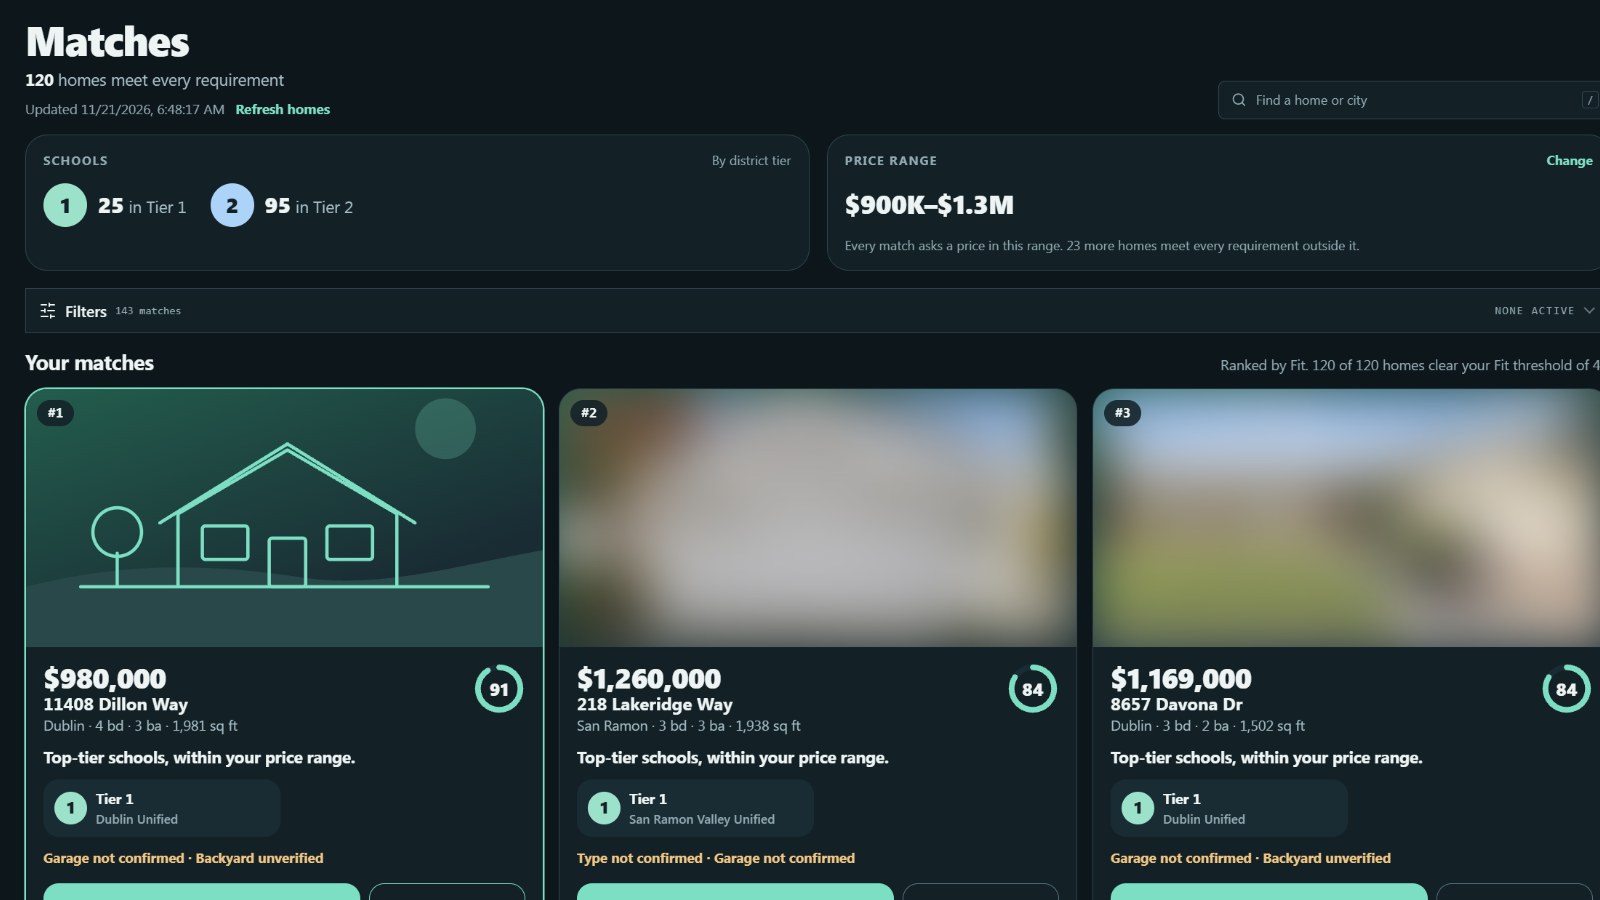
The first version modeled the whole purchase: cash to close, loan limits and debt ratios. It was careful work, and it answered the wrong question. A read-only measurement showed that every match read 'Stretch' by construction, so the budget verdict told us nothing, and the household asked for something simpler. One decision record replaced it with a price range. The financial engine, the Financial and Risk scoring categories and their settings were deleted from the code, not hidden, and six unused panels went with them. What is left answers two questions first, on every screen: is it in our price range, and how good are the schools?
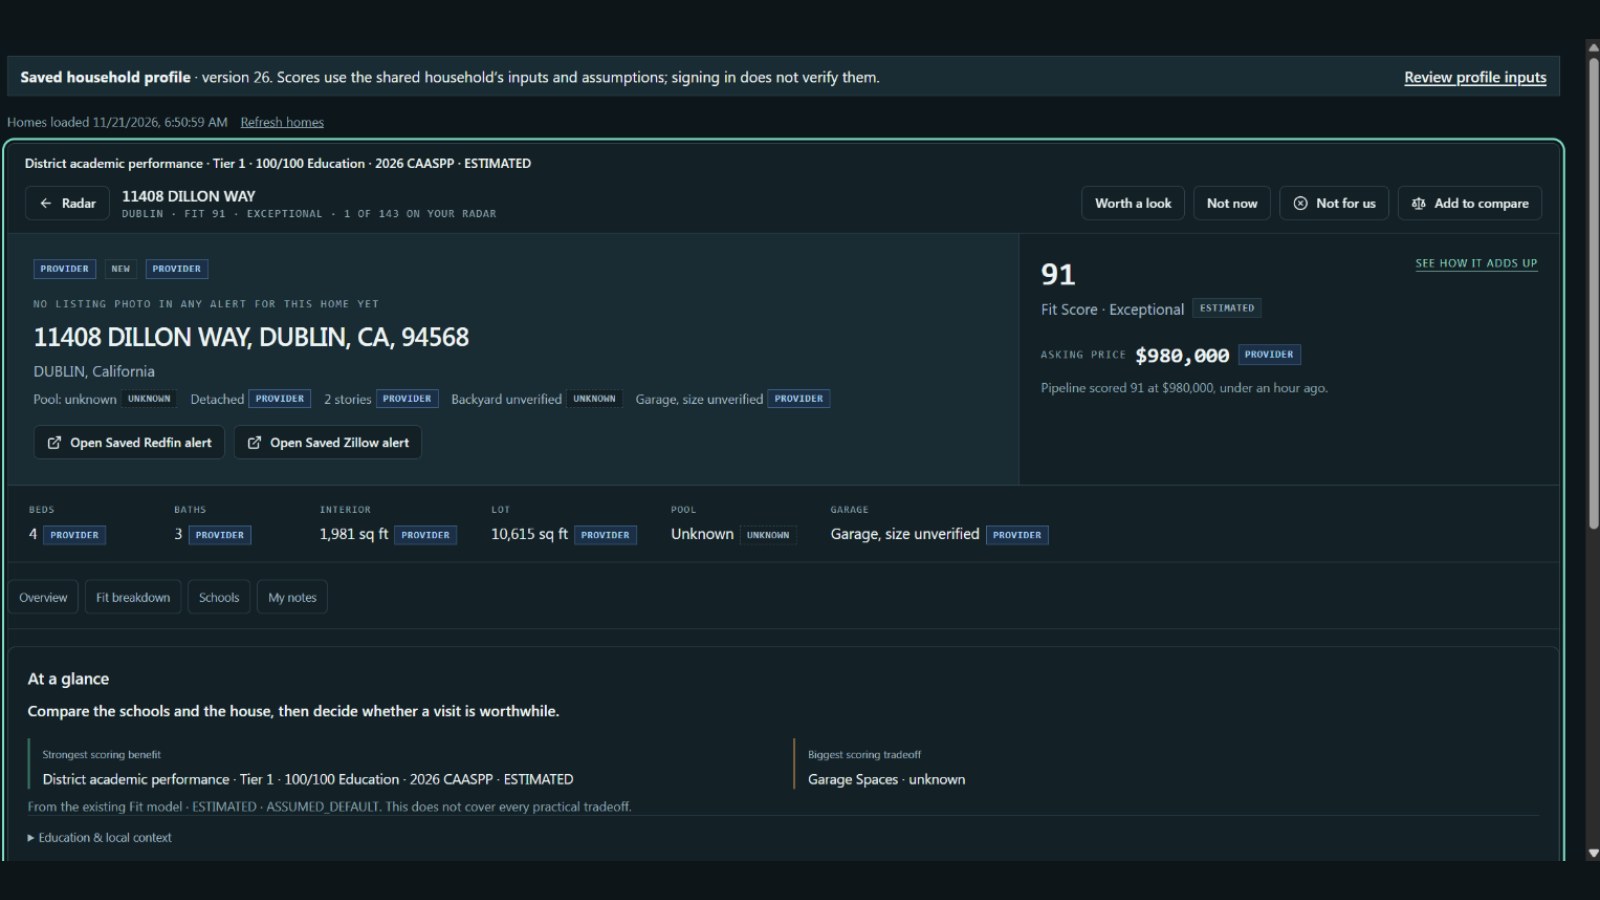
Every value in the data model carries one of seven kinds: verified, provider, estimated, user input, assumed default, demo or unknown. Two of them are dangerous because they produce a plausible number, so an assumed default or a demo value never renders without its label. The full analysis shows the rule at its loudest, with a badge on every fact and a link back to the alert each home came from. The everyday screens relax it on purpose: confirmed values carry no badge and a footer names their sources and freshness, estimates carry a '≈', and anything assumed or unknown is named in words beside the value.
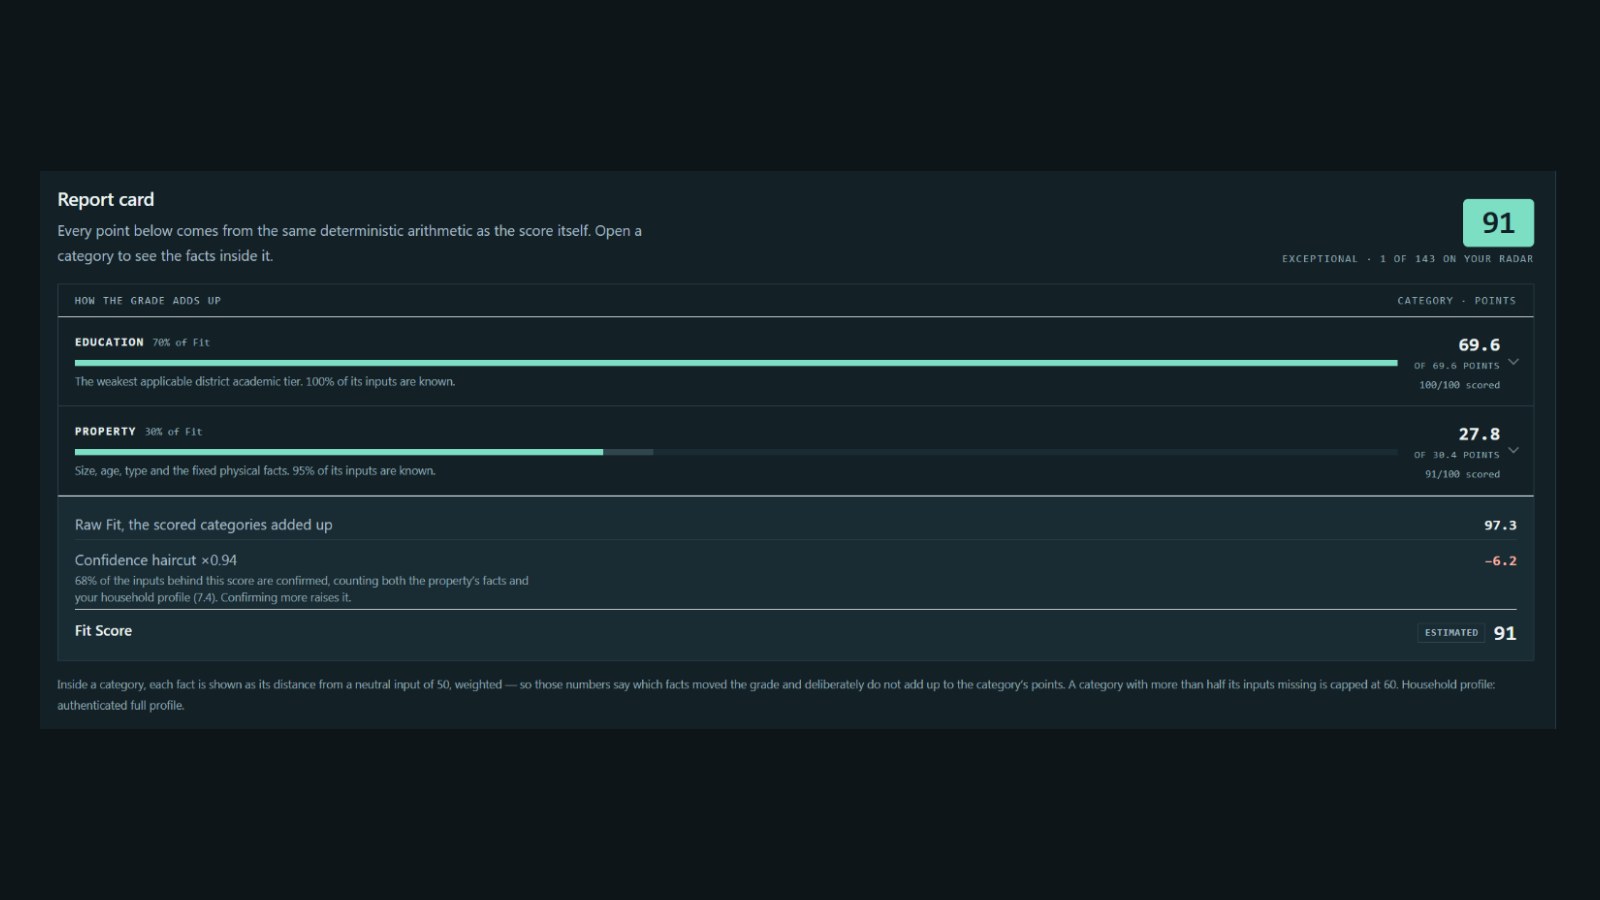
The scoring engine is pure, synchronous TypeScript with no I/O, so the same inputs always give the same score, and golden tests pin the results. An unknown input contributes zero but keeps its weight, a category missing more than half its weight is capped at 60, and the total takes a confidence haircut. This home scores 97.3 on what is known, but only 68% of the inputs behind it are confirmed, so it shows 91. An unknown garage is unknown, never two cars, and every default carries a source and a date until the household confirms it. The report card is built from the same arithmetic as the score, so the two can't disagree.
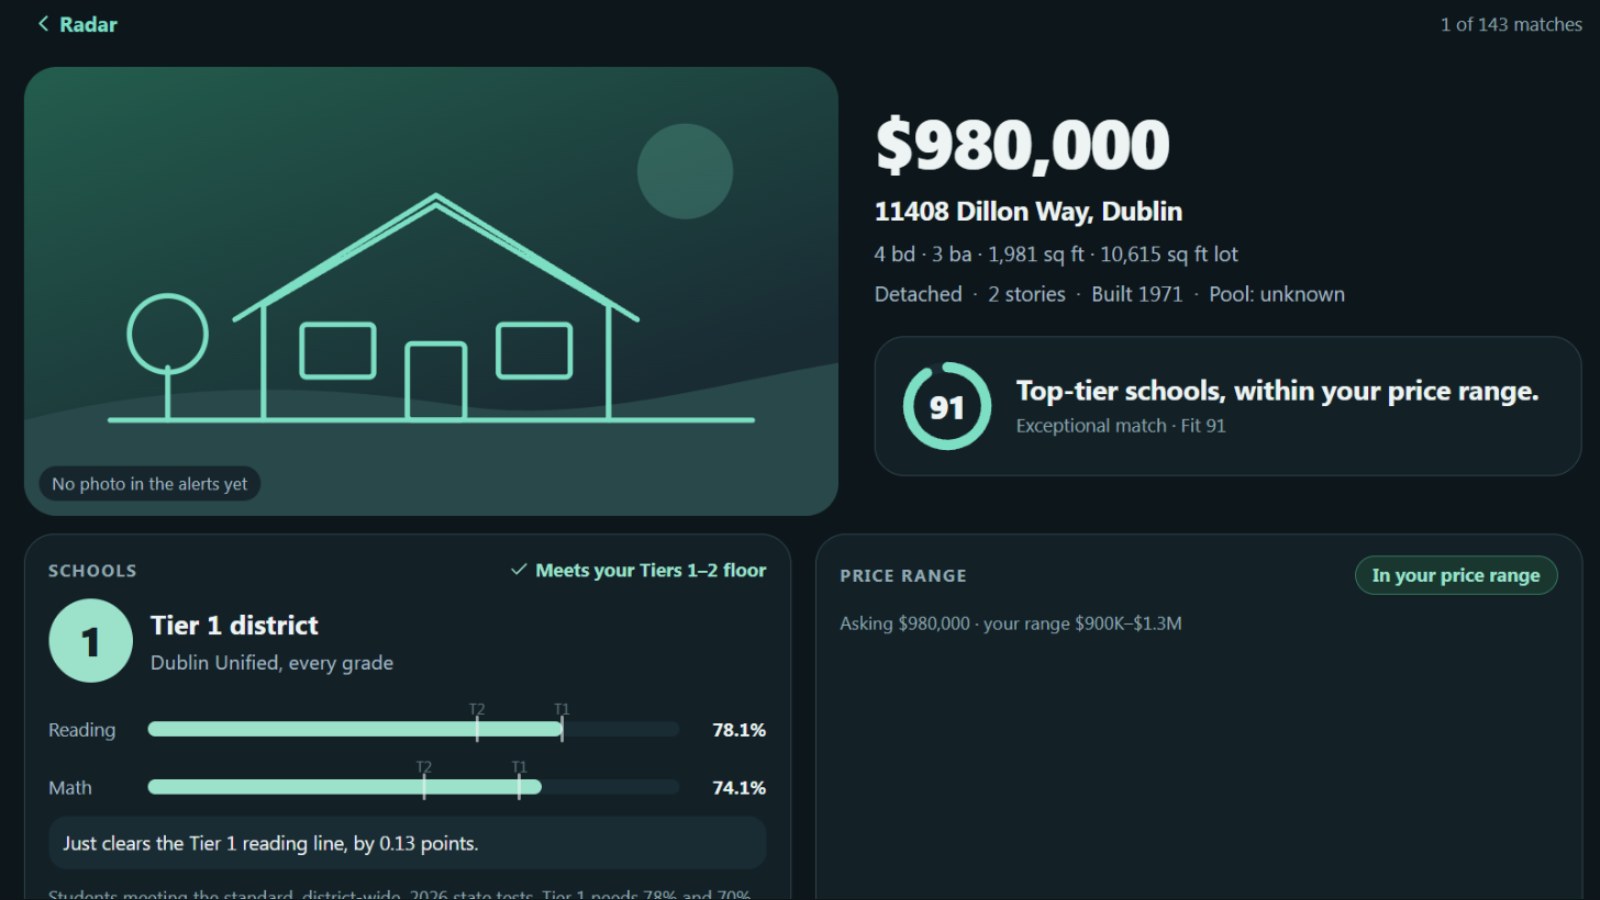
Schools are judged by district, from official state test results. A home's tier is the weakest of its elementary, middle and high school districts, and reading and math must both clear the line. The screen shows how close it was: this district clears Tier 1 in reading by 0.13 points. That tier and the price range make each home's headline, 'Top-tier schools, within your price range', and it is written once, in the shared core, so the home's screen, the matches list and the morning email can never word it differently. Each email card leads with those two answers and links straight to this screen.
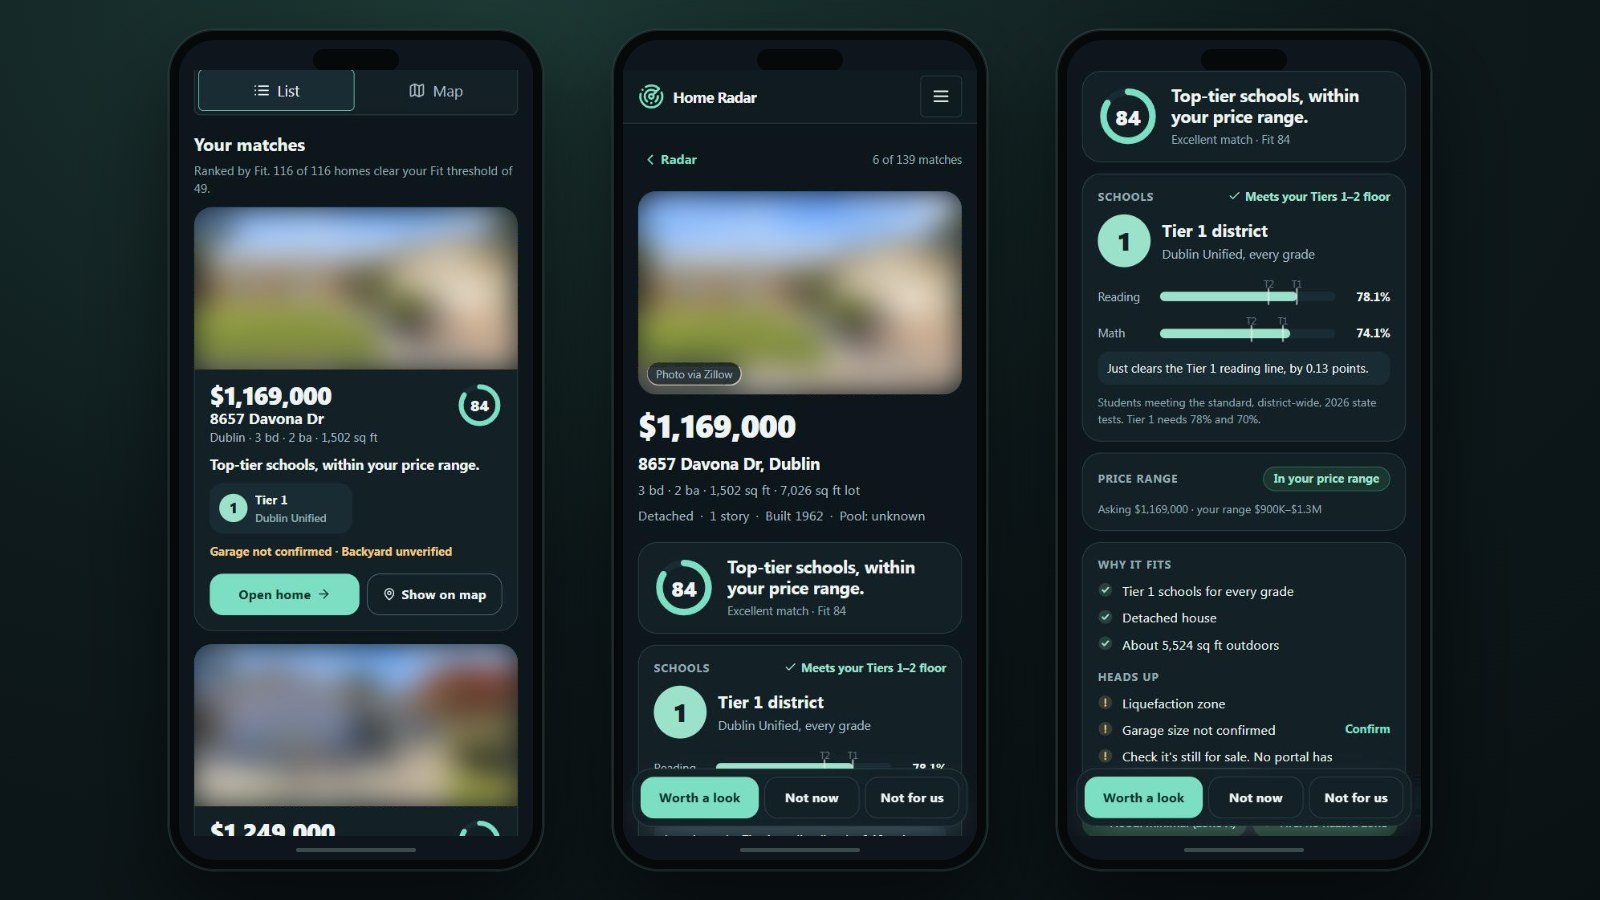
On a phone the radar opens on the ranked matches, with a switch between list and map. Opening a home used to bring up a toolbox: 30 fold-out panels, 99 source badges and 57 buttons and links for a single house. The household asked for 'a quick glance' instead, so the screen now answers the two questions first. The price, the address and the headline fill the first screen; the schools and the price range come next, then at most three reasons it fits and three things to check, with a Confirm link beside each fact that isn't confirmed. The three verdicts stay pinned to the bottom of the screen, and one tap records one, with an Undo. At release a home came to about 218 words, a little over two phone screens. The target was two, and the two answers weren't cut to meet it.
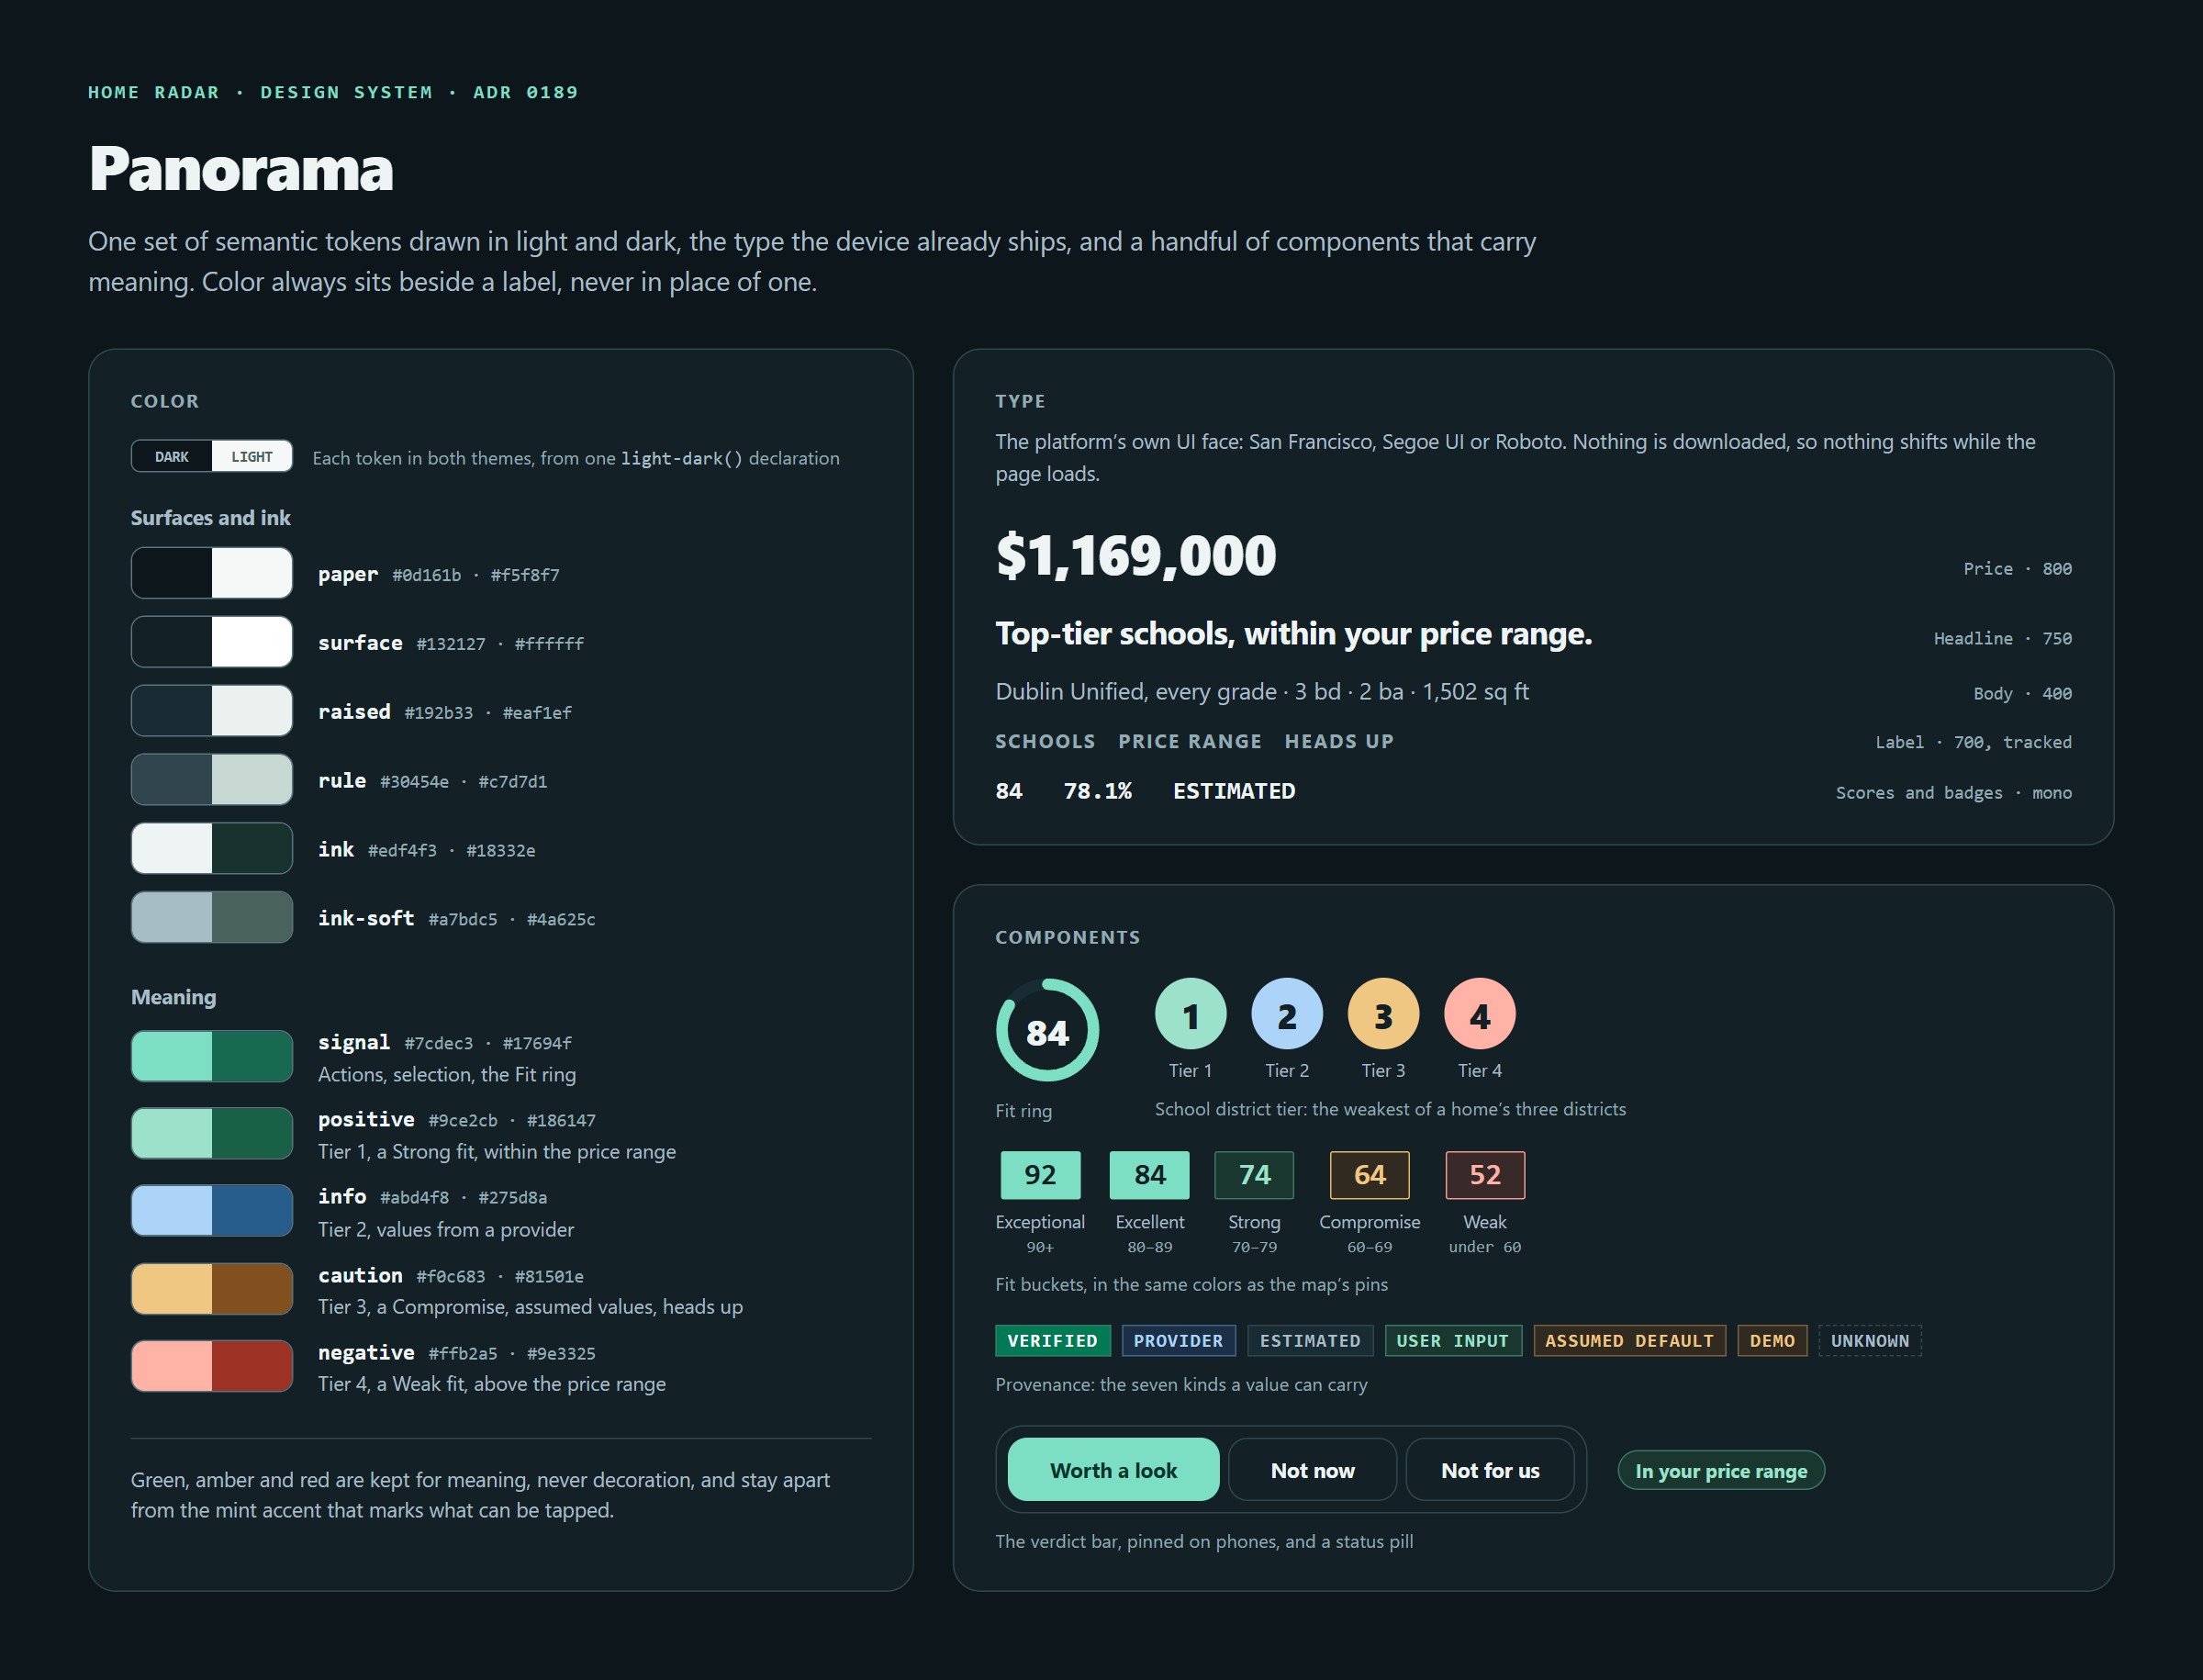
Panorama is the app's design system, chosen by the household from a prototype and applied to the app and the morning email alike. It is deliberately small. Colors are semantic tokens, such as signal, caution and negative, and each is declared once with its light and dark values side by side. Type is the platform's own, so nothing downloads. A handful of components carry meaning, and reuse it: a Fit score's chip wears its bucket's color, the same as its pin on the map, and a tier medal shares its color with the school's test bars. Color always sits beside a label, never in place of one.
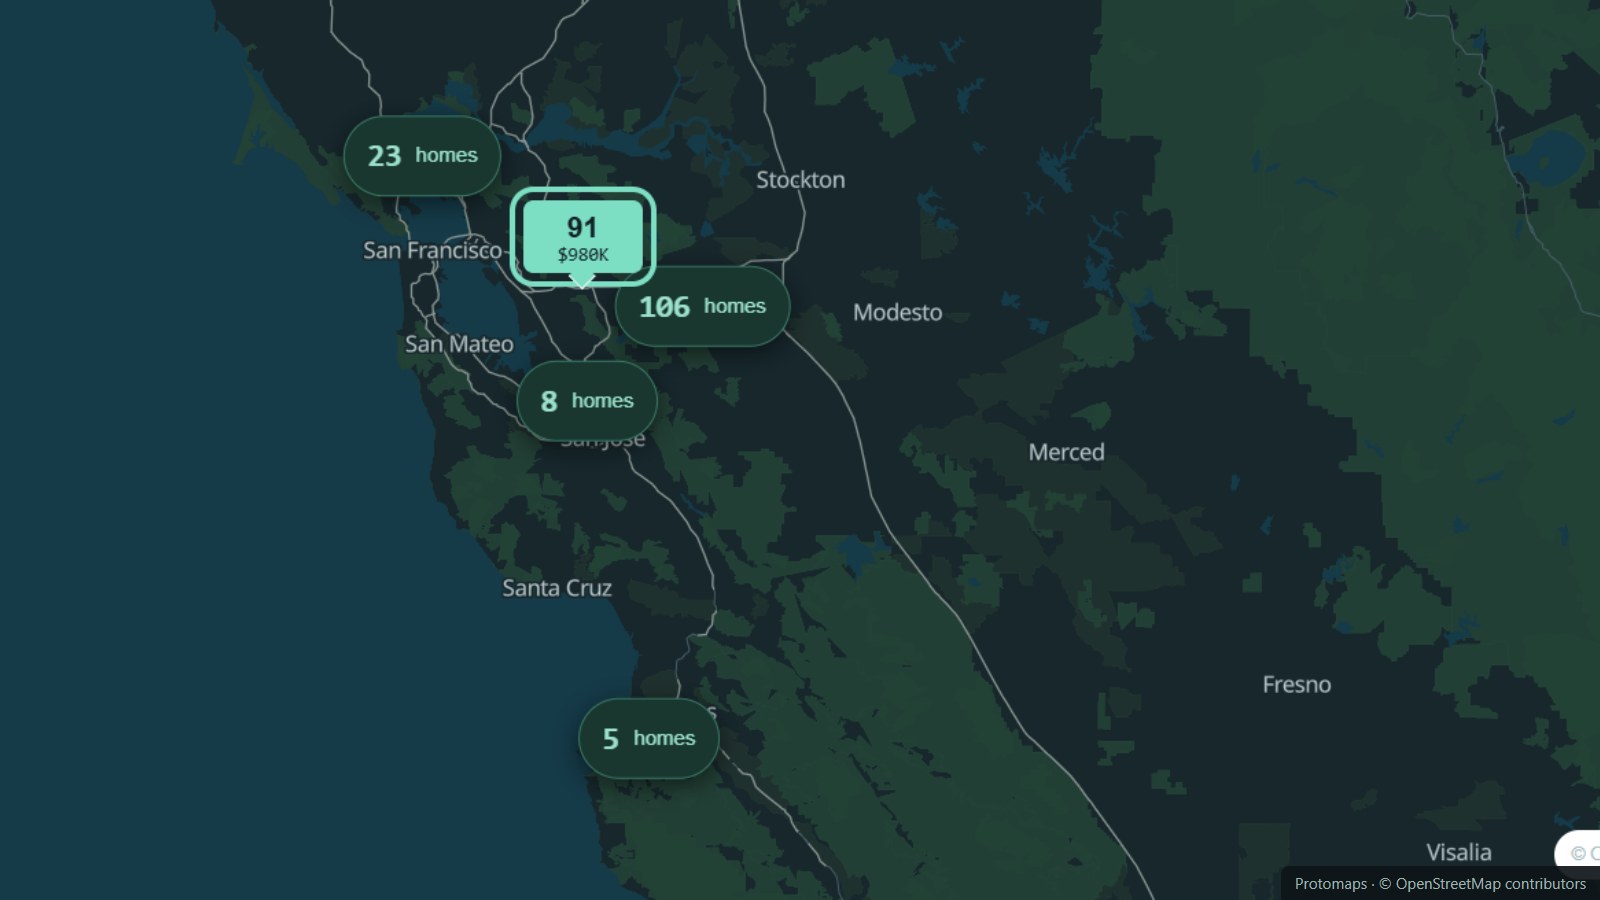
The basemap is a Protomaps archive of OpenStreetMap data on object storage, drawn by MapLibre, so there is no map API key and no per-load bill. Nothing long-running happens inside a web request: the web app and a separate worker deploy to Vercel, Supabase Cron supplies the clock, and each tick asks the worker for one bounded run, with state in the database deciding what is due and how to back off after a failure. A health banner names a failing job only when someone here could fix it; an outside source's expired certificate is noted quietly instead. Phones get Web Push from a small edge function, capped at three automatic notices a day per device. When the radar passed about 640 homes and its single read grew too long for the API gateway, reads were split into batches of 150.
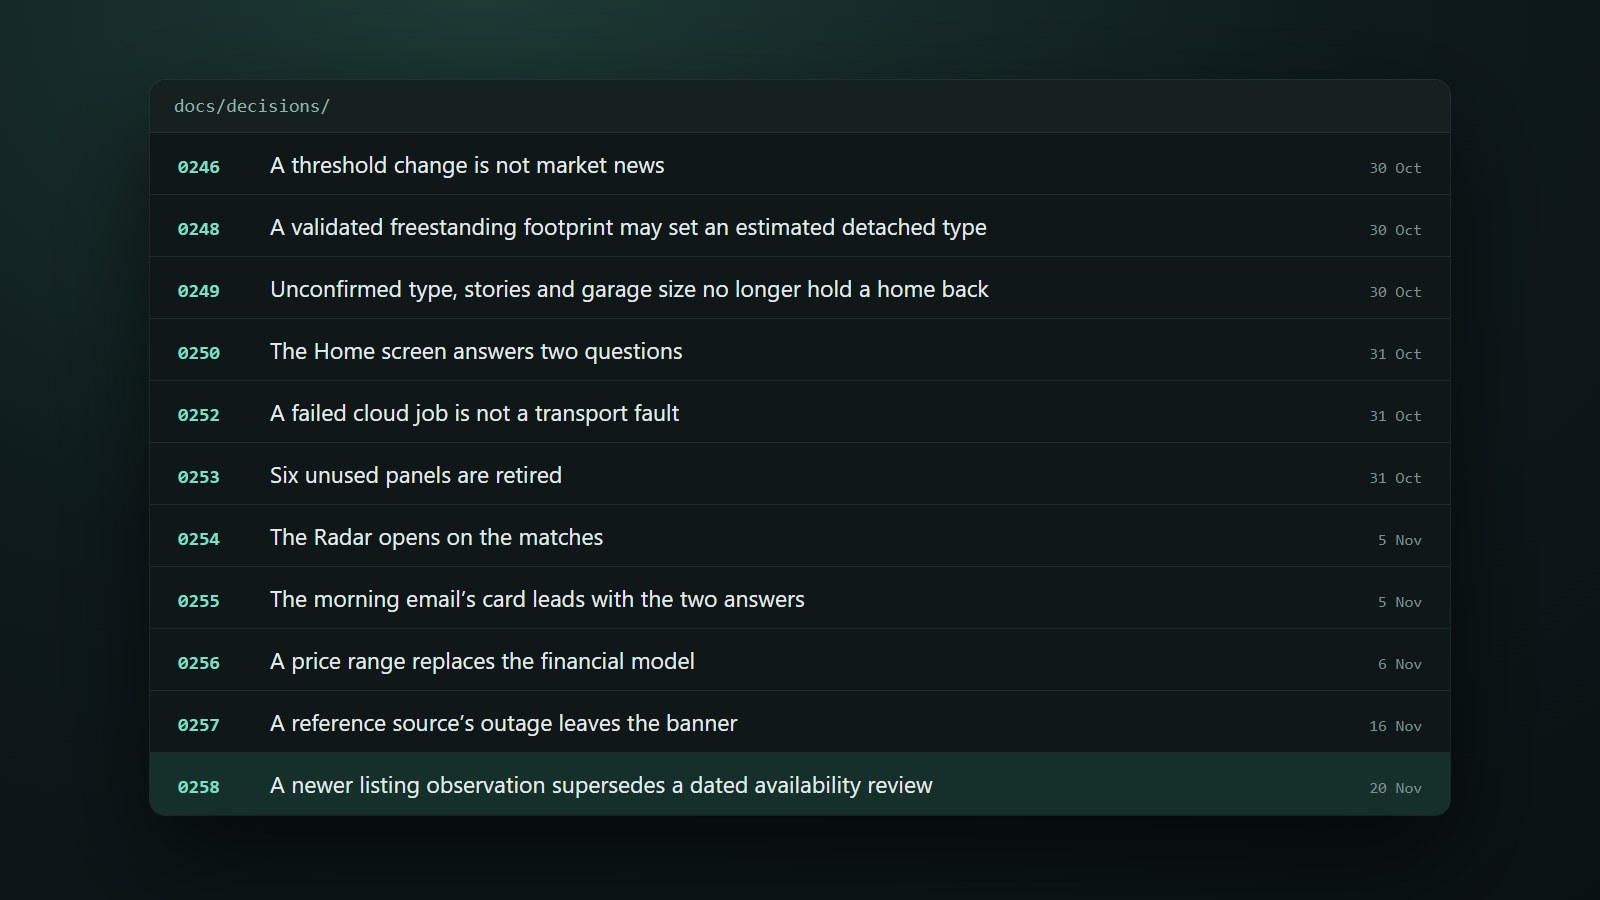
Home Radar was built with two AI coding agents, Claude Code and Codex, and the repository is written for them. AGENTS.md is the single source of truth both read at the start of every session, and the documents outrank any prompt. Claude Code leads on architecture, interface and React; Codex on migrations, parsers and scoring math, and it reviews the work, grading findings from Critical to Future. An unresolved Critical or High finding blocks the next checkpoint. Any change to a formula, a weight or the price rule needs a test and a decision record that quotes the household's own words. In three months that came to more than 250 decision records and 1,200 commits.

